| Сегодня 16 марта, понедельник |
|
|
|
Какой рейтинг вас больше интересует?
|
Главная /
Каталог блоговCтраница блогера Кино oнлайн/Записи в блоге |
|
Кино oнлайн
Голосов: 1 Адрес блога: http://protelemag.ru/load/ Добавлен: 2011-09-28 02:02:58 блограйдером petol |
|
EUR/USD Buy Avobe Fractal 1.2767 - May 15, 2012 (Daily Strategy)
2012-05-15 18:19:44 (читать в оригинале)
This morning during the American session, the euro fell sharply around the second weekly support area mainly due to the problems in Greece as the political parties fail to agree on a coalition government which in turn caused a strong opposition to the austerity measures demanded by the country's multilateral lenders.
On a technical level we observe a very strong fractal formed at the level of 1.2767; this dynamic fractal serves as a support level. We believe that this level around the fractal is a good place to go with the upward bounce of the pair or for conservative ones; we can enter by buying only if price closes today's session above 1.2801 weekly support; our goal therefore will be placed over the last gap in 1.3123
The indicator range is showing strong oversold level. The correction of the euro is expected in the nearest future.
The material has been provided by Instaforex Company - instaforex.comFundamental Analysis for May 15, 2012
2012-05-15 17:23:42 (читать в оригинале)
The resurgence of European debt crisis is affecting the markets. The euro has dropped in the early Asian session, leaving a gap at 1.2920 against the dollar, which has not yet been filled and added to another one closed last Monday at 1.3085.
The situation in Europe is not clear. On the one hand Spain experiences more difficulties and continues to pay its debts for their indebtedness and social protests that flared up austerity plans imposed by the government which spent cartridges of confidence in their first year of life.
But it benefits two key factors that can tip the balance in the coming months: the last month’s confusion in Greece resulted in a political revolt, as it was expected and prevents the creation of the new post-elected government two weeks ago. In this context Greece looks like the source of political changes. France in its turn can be exploited to overcome the oppression imposed by Germany which forced the Greeks and most of the Europe to impose very harsh austerity plans.
If France stops being a staunch ally of Germany, as we see Chancellor Merkel and most of the world, the outlook for the Europe for this year and next years will be different. In case Germany yields to pressure its neighbors and impose cash injection plans, which can generate growth or inflation, according to the use, the euro will be seriously affected.
If Europe’s plans to inject money in its nations including France, Greece and other politically related countries, a resurgence of inflation is not close due to subsidies. If the public sector is activated, Europe will experience a rebirth later, but it will be sustainable. Once again everything depends on politics, as always.
As for the euro, at the moment no corrections are expected due to the turnaround of the single currency that get high speed along with other hard currencies, such as Swiss franc and the Australian dollar.
The pound sterling remains in a more moderate downward trend, being replaced by the euro although its fundamentals do not forecast a change in trend that is currently imminent.
Yen on the contrary is making use of the crisis being refuge currency for investors. Its late growth reflects the concern of the markets particularly the fact that they engage with the JPY in order to establish as a sort of second dollar.
The observed significant drop in oil also affects the Canadian dollar and Mexican peso, two currencies linked to it. The loonie is far from parity against the dollar which is not surprising: it is expected to reach the point above 1.03. The weight has not undergone significant changes, so the fall is expected in the nearest future towards 13.70.
GBP/USD Intraday Technical Analysis and Linear Regression Channels for May 15, 2012
2012-05-15 16:03:27 (читать в оригинале)
The depicted chart illustrates the current situation of the GBP/USD currency pair on the 4H timeframe.
The GBP/USD pair is currently testing the lower limit of the almost identical bearish channels around 1.6050 which may constitute a suitable price level for bulls to initiate a bullish swing.
Price Zone 1.6040-1.6060 constitutes a strong support zone for the pair which pushed the pair towards 1.6120 Yesterday failing to maintain higher levels.
Price should be maintained above 1.6040-1.6060.Otherwise, a quick decline towards 1.5960 will probably take place.
Price Zone 1.6140-1.6160 is considered a strong resistance level for the GBP/USD pair for those who look for bearish opportunities.

The Hourly chart gives a similar view for the GBP/USD.
The GBP/USD PAIR has been downtrending within the depicted Blue & Yellow bearish channels for almost three days with bearish breakout below the lower limit of the Violet channel.
The GBP/USD pair is now testing the mid-line of the Yellow & Blue channels around 1.6050 which will determine the next target for the pair.
The GBP/USD pair has an Intraday support level at 1.6000 which corresponds to the lower limit of the bearish Yellow channel and an Intraday resistance level at 1.6090-1.6110 corresponding to the upper limits of its movement channels.
The material has been provided by Instaforex Company - instaforex.comEUR/USD Current Targets and Technical analysis
2012-05-15 15:12:10 (читать в оригинале)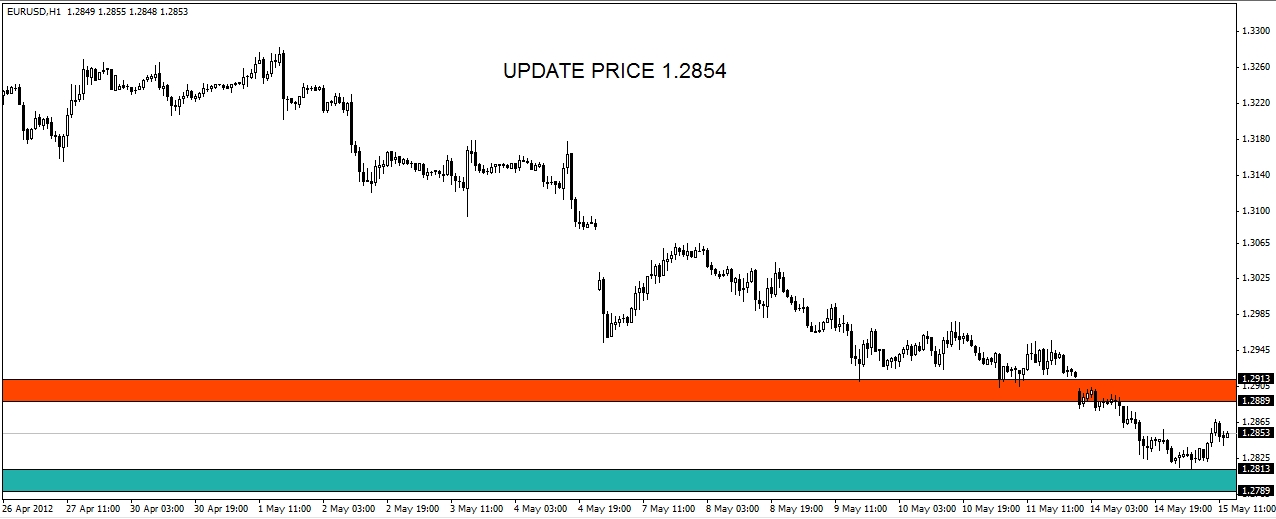
Overview:
As it was mentioned in my previous article, the pair is expected to fill the gap soon. Therefore it is recommended not to sell the pair at the moment. A move towards recovery is imminent and it might reach 1.2900/20 level.
Recommendation:
If you are in selling positions you can close them between 1.2813 level and 1.2789; the same range is suitable for the short-term buying as well.
If you are in buying positons, then the suitable level range will be from 1.2889 to 1.2913 the same range is suitable for the near-term selling as well .
Trends:
Near Term: Sideways
Short Term: Downward
Medium Term: Sideways
Warning:
Analysis and technical levels are provided only for the educational and informative purposes. Please check also the fundamental analysis before opening every single position. Keep yourself away from the market, if the market is volatile. Always try to open positions with good price level. Remember Forex is like fishing, not like hunting.
Money Management Warning:
Never risk with more than 2 or 3% of your equity in a trade:
For Example 2% of 1000 USD is 20$ and if your stop is 50 pips then your lot size will be calculated as 20$/50 = 0.4 of insta lot which means it will be about 40 cents and similarly if your stop level is 100 pips than lot size will be calculated as follow 20$/100 = 0.2 Insta lots it will be about 20 cents.
USD/CAD Elliott Wave Count for May 15, 2012
2012-05-15 15:10:35 (читать в оригинале).png)
USD/CAD Elliott Wave
Yesterday during the European session we could observe the ascending movement towards the 1.0050 level. We can consider this movement as the end of the 1 wave (coloured blue) of the bigger (3) wave (coloured green). Therefore during the New York session the USD/CAD pair start pushing lower towards the 1.0012 level (100 EMA support). Having tested this level the USD/CAD pair pushed slightly higher and we could observe the price back at 1.0040. Today during the Asian session we could observe the continuation of the bearish mood and price touching 0.9993 level. We can consider this move as the end of the wave 2 (coloured blue). Presently we are in the 3 impulsive wave (coloured blue). In accordance with our wave rules and taking into account that the wave 3 retraces 161.8% of the wave 1, we can define the potential targets with Fibonacci extensions (0.9953-1.0050-0.9993) with Take Profit 1 at 1.0128 (161.8% of wave 1) and Take Profit 2 at 1.0165 (200% of wave 1). The Invalidation point at 0.9954 level can be used as Stop Loss. Also it is necessary to consider the data concerning the U.S Core CPI m/m, Core Retail Sales m/m, Retail Sales m/m, CPI m/m, Empire State Manufacturing Index, TIC Long-Term Purchases and Business Inventories m/m that can affect the rate of the pair.
Support and Resistance levels
(S3) 0.9964 (S2) 0.9987 (S1) 1.0002 (PP) 1.0026 (R1) 1.0049 (R2) 1.0064 (R3) 1.0088
Trading Forecast
Proceeding from Elliott Wave Rules this week the trend is expected to begin the upward movement. That is why Long positions at level 1.0020 with Stop Loss at 0.9954, Take Profit 1 at 1.0128 and Take Profit 2 at 1.0165 are recommended.
|
| ||
|
+129 |
132 |
Bagdad |
|
+113 |
131 |
QoSyS |
|
+108 |
135 |
{dimaka} |
|
+97 |
143 |
Yaroslav Starovirets |
|
+77 |
137 |
ProgBook - книги и учебники по программированию |
|
| ||
|
-2 |
6 |
Robin_Bad |
|
-9 |
3 |
livenebo |
|
-11 |
43 |
Илья |
|
-15 |
4 |
V_exeR |
|
-16 |
2 |
Блог интернет-разработчика |
Загрузка...
взяты из открытых общедоступных источников и являются собственностью их авторов.